

The directory logs update entries for every game it tracks. That log is not a changelog written by developers — it is a record of what this directory has observed. Understanding the difference is the whole skill, because almost every wrong conclusion about a game's activity comes from reading the entry count as if it were a release calendar. Here is the full picture across 89 games on November 3 2026.
Across 89 games the log holds 697 entries, a mean of 7.8 per game. The most common single value is 1 entry, held by 17 games, and 17 games carry exactly one entry.
| Bucket | Games | Share |
|---|---|---|
| 1 entries | 17 | 19.1% |
| 2 entries | 6 | 6.7% |
| 3 entries | 5 | 5.6% |
| 4 entries | 2 | 2.2% |
| 5 entries | 8 | 9.0% |
| 6 entries | 6 | 6.7% |
| 7 entries | 3 | 3.4% |
| 8 entries | 9 | 10.1% |
The distribution has a long tail. 31 games carry ten or more entries while 30 carry fewer than five. That spread is not primarily a measure of how hard different studios work — it reflects how long each title has been tracked and how frequently it produces visible changes worth logging.
| # | Game | Entries | Live rank | Playing now |
|---|---|---|---|---|
| 1 | +1 Speed Keyboard Escape | 23 | 38 | 15,343 |
| 2 | [NEW SNIPER] Sniper Arena | 23 | 40 | 14,925 |
| 3 | Dress To Impress ⭐ | 23 | 16 | 49,078 |
| 4 | Slayers 2 | 22 | 50 | 10,177 |
| 5 | Steal An Egg | 20 | 1 | 621,262 |
| 6 | Launch a Lucky Block | 20 | 87 | 545 |
| 7 | Build An Ant Empire | 17 | 73 | 3,767 |
| 8 | Anime Dice | 17 | 15 | 50,497 |
| 9 | [] Steal a Brainrot | 16 | 9 | 78,128 |
| 10 | [SKY ASSASSIN] Jujutsu Shenanigans | 16 | 7 | 94,775 |
| 11 | Grow a Garden | 16 | 35 | 16,859 |
| 12 | The Strongest Battlegrounds | 15 | 8 | 87,718 |
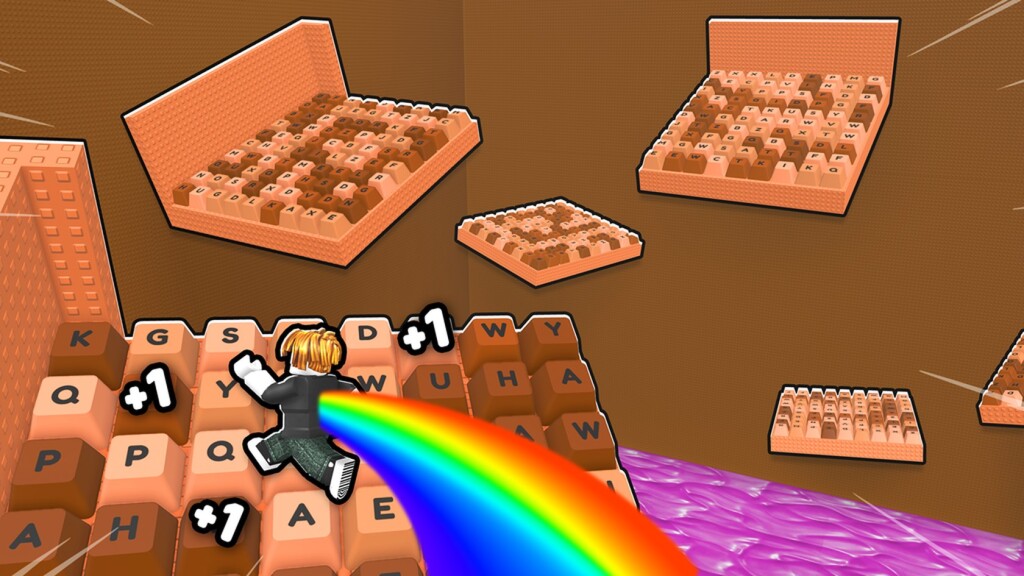
Three games tie at 23 entries: +1 Speed Keyboard Escape, [NEW SNIPER] Sniper Arena, Dress To Impress ⭐. The first of those is an obby title — the category list is on the obby games page, and its own entry is on the speed keyboard escape codes page. Dress To Impress ⭐ is another of the three, with 49,078 concurrent players and its own code page.
Note that a high entry count does not line up with a high live population. Steal An Egg has 20 entries and sits at rank 1 by concurrent players with 621,262 online, while the top of the entry table sits far lower on the live board. Entry counts and current popularity are answering different questions.
The log also carries two dates per game — when tracking started and when the most recent patch was seen. Dividing the span by the number of gaps gives a rough cadence in days per entry. It is rough, and it is the most misread figure in the set.
At the fast end, NewSmith RP runs at 1.0 days per entry across 2 entries, and Dress To Impress ⭐ at 1.3 days across 23. A figure near one day means the two dates are 1 days apart, not that patches arrive daily forever. The median cadence across the directory is 2.5 days per entry (Huss Valley).
At the slow end, [] Adopt Me! shows 415 days per entry over 2905 days and 8 entries, and Blox Fruits shows 386 days. Those are almost always games where tracking started long ago and entry counts stayed low — the figure measures the gap between two dates divided by a small number, not a shipping schedule.
17 games carry one entry. The natural reading is "this game has shipped once", and that reading is wrong. One entry means this directory has observed one change since it began watching. For a recently added title that is expected regardless of how active the game is.
The way to tell the two apart is the pair of dates. If tracking started recently and there is one entry, the game is new to the directory. If tracking started years ago and there is one entry, the game genuinely changes rarely. Both patterns exist in the current data, and the entry count alone cannot distinguish them. 0 games currently show an entry count without a usable pair of dates, so for those the cadence figure simply cannot be computed.
Entry counts cluster loosely by genre. The simulator set, which you can browse on the simulator games page, tends toward higher counts because progression games ship balance changes frequently. The roleplay set tends lower, because social games change their world less often than they change their events. These are tendencies across 89 games, not rules, and any individual title can sit anywhere in the range.
The practical use is to compare within a category, not across one. Asking whether a simulator is more actively tracked than another simulator is a fair question with a real answer. Asking whether a simulator is more actively tracked than a roleplay game is mostly measuring how each genre produces visible changes.

The entry total grew from 632 to 697 between the two most recent syncs, and most of that growth is not new patches. It is new games finishing sync and bringing their existing history with them. This is worth internalising before you read any movement in the total as a signal about developer activity.
The same effect distorts the mean. 7.8 entries per game is an average over a population that keeps changing shape, so it moves when the sample moves as well as when the log grows. If you want a stable figure, use the per-game entry count and the two dates that bound it; those describe one game and do not depend on what else is in the directory.
Start with the two dates, then the count, then the cadence. Dates first because they bound everything else: a 20-entry game tracked over 28 days is a very different proposition from a 20-entry game tracked over four years, and only the dates tell you which. Count second, as a measure of how much visible change accumulated inside that window. Cadence last, and only as a derived convenience.
Two walkthroughs cover this in more detail: the three-fields guide explains each field individually, and the directory breakdown covers the per-game distribution from a different angle. The underlying caveat is the same in both: the log records what was observed, and the absence of an entry is not evidence that nothing shipped.
One boundary condition: 4 of the 93 tracked titles are missing at least one statistic and are excluded from every figure here. When they finish syncing, the total moves and the distribution shifts — which is what happened between the November 1 and November 3 pulls.